Reports
📊 The reports dashboard is a powerful tool to measure and analyse various aspects of a call done via the auvious platform. You can also create multiple dashbboards and add different widgets to each dashboard.
All metric data are calculated and displayed in UTC time.
Available metrics
Here is a list of the available metrics that can be shown in our dashboard. More will be added with future releases.
- Video calls created: includes all calls created during time window. Note that this includes calls scheduled during and NOT for the specific time window.
- Video calls participants connected: includes all calls that both the agent and the customer joined the call.
- Video calls performed: includes all calls that were completed (including abandoned) during time window.
- Video calls abandoned: includes all calls that were "abandoned" during time window. "Abandoned" are the calls where no other user besides the agent, joined the call.
- Video Calls With Small Duration: includes calls where customer joined but duration was less than a minute, which could reflect an issue on the customer side.
- Video Calls With Normal Duration: includes calls with normal duration (>1minute), which should reflect number of successful calls
- Video Calls With Long Duration: includes calls with unusual long duration (>4hours), which could be normal, could be service abuse, or a bug in the system.
- Interactions created: includes all interactions created during time window, an interaction is created when the agent actually joins a call, so this reflects the number of calls that agents joined during time window.
- Ratings submitted: number of ratings submitted by both agents or customers during the time window.
- Ratings average score: average score of ratings submitted during time window
- Concurrent calls max: peak video call concurrency during time window
- Concurrent calls average: average video call concurrency during time window
- Conference average duration: average duration of a video call, here duration is the time where at least one user is active.
- Conference total duration: total duration of a video call, here duration is the time where at least one user is active.
- Call average duration: average duration of a video call, here duration is the time where at least two users are active in the call.
- Call total duration: total duration of a video call, here duration is the time where at least two users are active in the call.
- Call hold total duration: total duration of the time the call was put on hold.
These metrics are aggregated according to periods in time. For your convenience we have created a list of time range presets to choose from.
Data visualisation
There are three different types of data visualisation.
- S: Small. Aggregated total or average of a metric during a specific period.
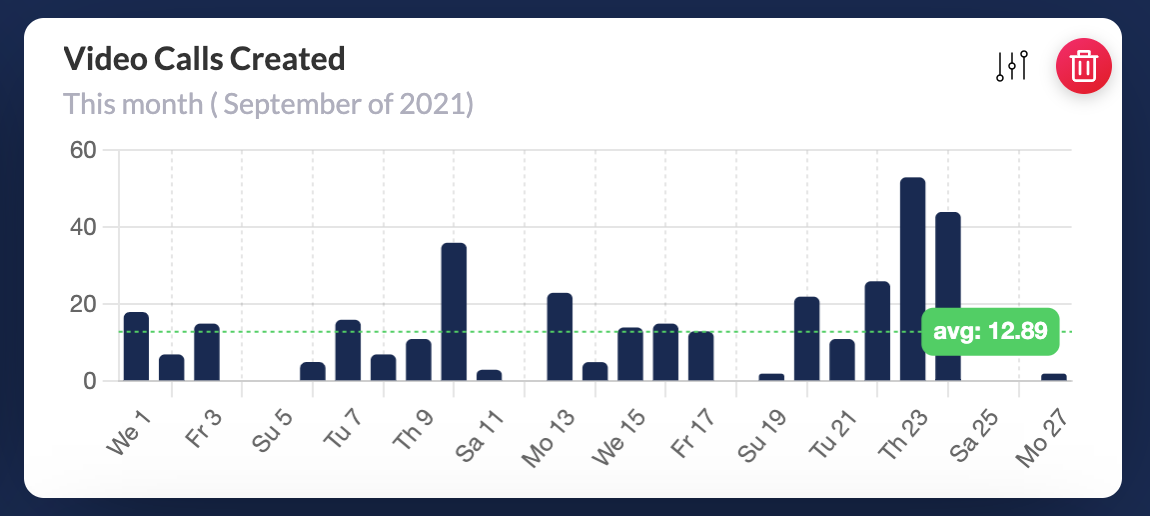
- M: Medium. A bar chart view of the metric during a period.
- L: Large. A data list of the metric during a specific period.
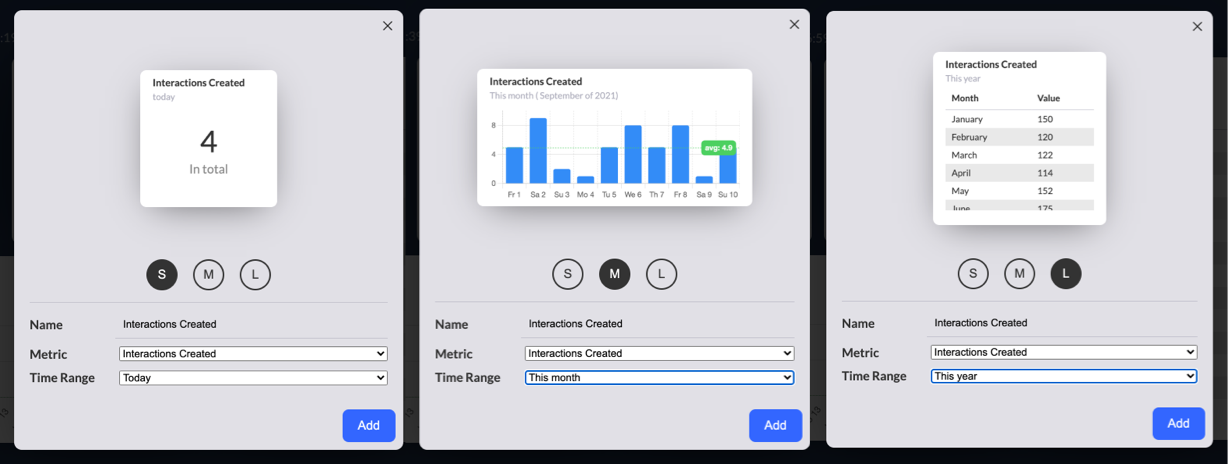
Adding a new metric
The reports dashboard comes with four pre-defined metics. To add your own metric click on Edit widgets and then click on 'Add widget`. Select a metric, the time range and click on 'Add' to add it to the dashboard.
Only an admin can edit the metrics dashboard and add/remove metrics
While in edit mode, you can remove a metric by clicking the trash icon or click on the widget settings to change the name, metric type and time range.
After you have finished with all the changes, click on Done to save the new dashboard layout.